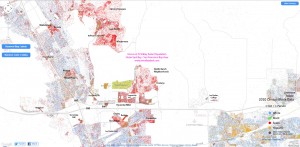
What’s a better testimony than numbers? That the Tri Valley Area is undergoing a demographic transformation can be generally seen, but is clearly depicted in this Racial Dot Map produced by the Weldon Cooper Center for Public Service based on 2010 Census data. The RED dots represent Asian Population, and its easy to see how the area looked like almost four years back. If anything, the density of the red may only be increasing in this area; in fact rather drastically over last couple of years.
Granted the red dots represent the Asian population as a whole, not people from Indian sub-continent as such. But going by what one may be observing see on the streets, stores and schools, and anecdotal data, it may not be an over statement to say that the desi Indian population is almost exploding at least in some specific areas.
The Dot Map below from Cooper Center has been over laid with specific local areas/streets to help easily identify the areas under focus.

The Map provides a good picture of which Tri Valley Areas are popular with the Asians or Indians. What really comes as no surprise is the Windermere, Gale Ranch, Camino Tassajara area of San Ramon, along Bollinger Canyon Road. Its known to be thickly populated with Indians and Chinese. On some streets and roads you will only find Indian households door to door, one after the other. Some people says its much of a South Indian microcosm. The schools of the area present the same picture – and have excellent scores. Next in San Ramon are some older areas in west San Ramon along Alcosta and Marketplace. Particularly apartments there are high density Indians. Coming down south, the Pine Valley area has some desi population, and further south, the area between Alcosta and Village Parkway in Dublin is again heavily dotted with red.
East Dublin is the other major desi area. Especially the last couple of years has seen a major influx of desis moving from all over the Bay Area into the Dublin Ranch neighborhood, including Positano and other new construction going on in the area at fast pace that supposedly provides some of the best value in the entire Bay Area. The prime area surrounding popular Emerald Glen park is pretty multi racial, but still reasonably desi as well. Especially towards the north of it. Dublin Boulevard from Hacienda to Village Parkway provides the best desi shopping experience with multiple stores and the Regal Cinema at Hacienda is always on with the latest Hindi release from Bollywood. The schools in the area are getting better every year – that is a no brainer. The Brigadoon area on the far west has a few desis living as well, and so do the apartments along the Dougherty Road. The apartment/condo living next to Bart in Dublin again has a good concentration of desi folks.
Pleasanton is where this Dot Map helps to give a more definitive picture than is generally known. The area between Owens Drive, Avalon Apartments and Stoneridge is heavily red. This has probably even gone higher in last year – especially with the apartments in the area. As Stoneridge meanders to the east, the homes around it are again pretty Asian, going up drastically around the south western end of Stoneridge. While West Pleasanton over all has a sprinkling of Indian population, the central business district goes quite opposite, and then again increases along 680, and showing high around the apartments south of Stoneridge Mall.
Asians are generally sprinkled over all of Tri Valley area, and Livermore shows the same pattern. The Indian population shows a little higher numbers around the Livermore Temple, kind of expected.
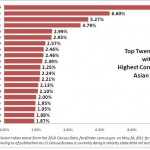
Check for the actual numbers from the 2010 Census for Asian Indians in Tri Valley Area with Percentage.
If you are aware of specific areas that are significantly growing in Indian Desi population, please feel free to comment below.

